Does a Chatbot Slow Your Website? How to Measure It
Worried a chat widget will drag down your site speed? Here’s a free, step-by-step way to test it yourself, read the results honestly, and fix any slowdown.
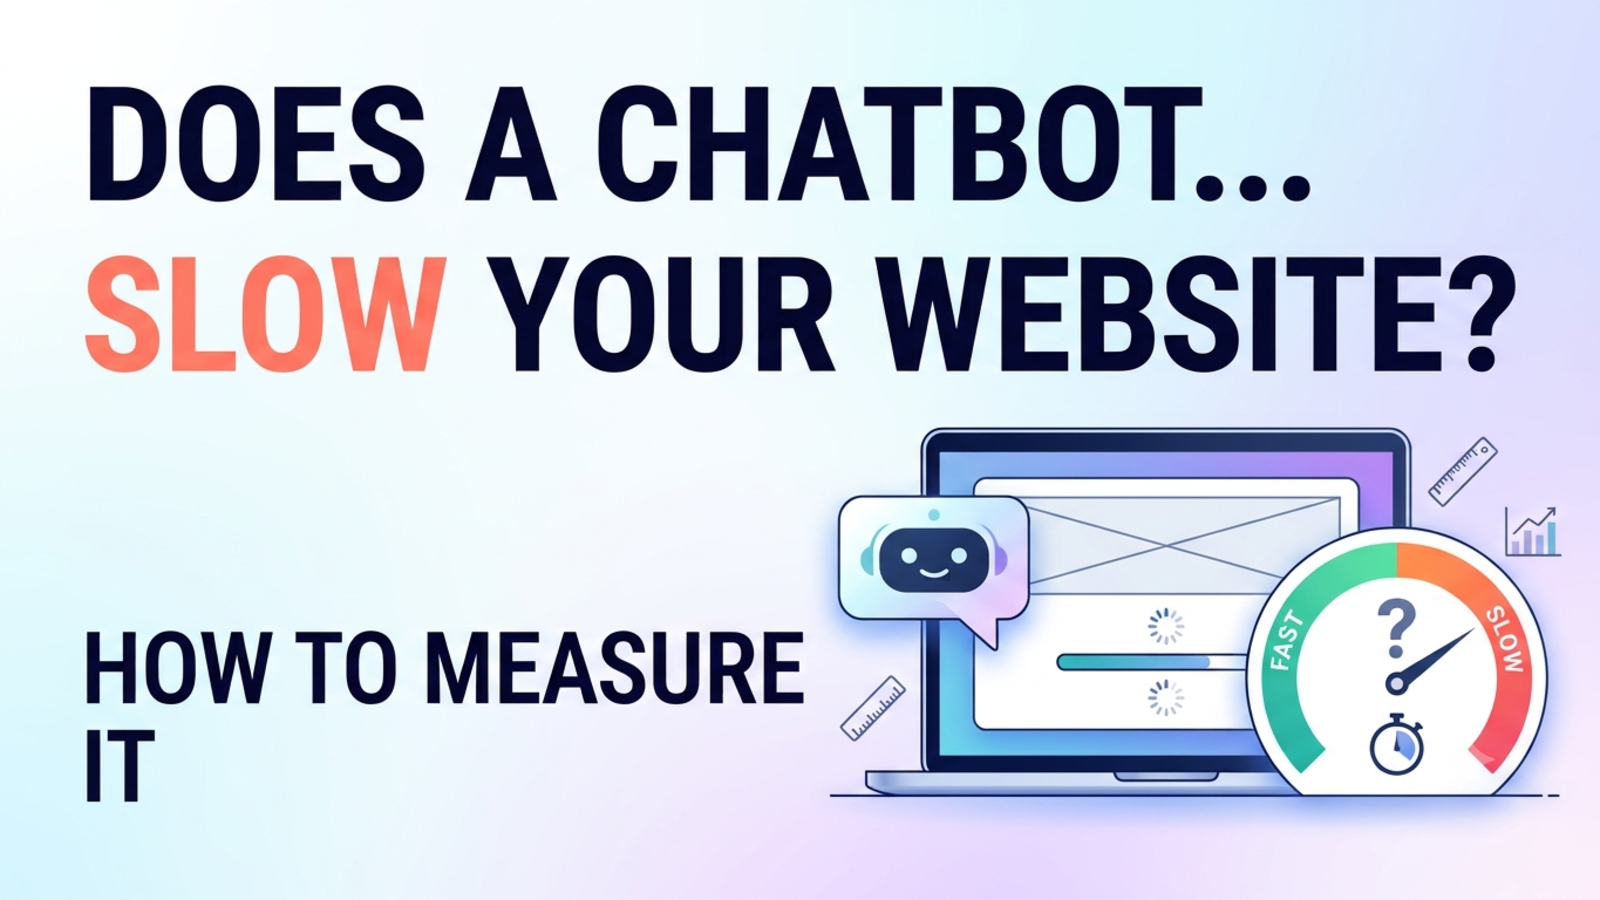
It’s a fair worry. You’ve spent time getting your website to load quickly, and now someone suggests adding a chat widget, another piece of code from another company, running on every page.
Will it slow things down?
The honest answer is: it depends on the widget, on how it’s loaded, and on your site. Any third-party script can add weight. Some add almost nothing, some add a lot, and you can’t tell which is which by reading a sales page, including ours. But you can find out for yourself in about 30 minutes, with free tools and no developer.
This guide shows you how, what the numbers mean, and what to do if the result isn’t what you hoped for.
Why a chat widget can slow a page down
A chat widget is a third-party script: code written by another company that your page downloads and runs. Third-party scripts can affect speed in a few ways:
They use the main thread. Browsers do most of their work on one main thread, and third-party scripts run there. One performance guide notes that these scripts can add roughly 50 to 500 ms of CPU time that blocks rendering and interaction. That’s a rough range from a vendor guide rather than a precise rule, but it shows the idea.
They compete for bandwidth. The widget’s files download at the same time as your own content, which matters on slower mobile connections.
They can delay interactions. If a visitor taps a button while the widget’s code is busy, the browser queues the tap until the thread is free. That’s how a script can hurt the responsiveness metric (INP), even if the page looked fast.
They can shift the layout. Content injected after the page loads can push other content around if the space wasn’t reserved. A floating chat bubble that sits in a fixed corner usually doesn’t, but it’s worth checking.
None of this means chatbots are bad for speed. It means the effect is measurable, so measure it.
The three numbers that matter
Google’s Core Web Vitals are the standard yardsticks. Here are the “good” thresholds, which are unchanged as of August 2026.
LCP (Largest Contentful Paint) tells you how fast the main content appears.
Good: 2.5 seconds or less
Needs improvement: 2.5 to 4 seconds
Poor: over 4 seconds
INP (Interaction to Next Paint) tells you how quickly the page reacts to taps and clicks.
Good: 200 milliseconds or less
Needs improvement: 200 to 500 milliseconds
Poor: over 500 milliseconds
CLS (Cumulative Layout Shift) tells you how much the page jumps around.
Good: 0.1 or less
Needs improvement: 0.1 to 0.25
Poor: over 0.25
Lab data vs field data (the part most people miss)
Two kinds of measurement, and they answer different questions.
Lab data comes from a controlled test: one device setting, one network speed, one location. It’s repeatable, which makes it ideal for comparing “with chatbot” and “without chatbot.” Web.dev describes it as a single device on a single network from a single location.
Field data comes from real visitors, reported by Chrome over a 28-day window. It shows what your actual customers experience, but changes take weeks to show up.
Here’s the catch for small sites: PageSpeed Insights may show no field data at all for your page if there aren’t enough real Chrome visits, in which case it might show data for your whole site or nothing. Google doesn’t publish a fixed minimum. That’s why the method below leans on lab testing, with a real-user check on the side.
The 30-minute test
You’ll compare your page with the chatbot and without it, several times, and look at the difference.
What you’ll need
A computer with the Chrome browser
A list of three important pages: your homepage, your most visited product or service page, and your contact page
A notepad or spreadsheet
Optional: a mid-range Android phone to test on for real
Step 1: Pick your test conditions and stick to them
Use an incognito window so browser extensions don’t interfere. Extensions inject their own scripts and can contaminate lab results.
Test on mobile settings. Many of your visitors, particularly in India, will be on mid-range phones and variable 4G. Lighthouse’s default mobile test emulates a mid-range phone on a slow 4G connection, which is a sensible starting point and a tougher test than your laptop on Wi-Fi.
Step 2: Measure the page with the chatbot
Two easy options:
Option A: PageSpeed Insights. Go to pagespeed.web.dev, paste your URL, choose Mobile and run it. PageSpeed Insights runs Lighthouse on Google’s servers and shows any field data on top. Note the LCP, TBT and CLS values, plus the “third-party” findings further down.
Option B: Lighthouse in Chrome. Open your page in an incognito window, press F12 for DevTools, open the Lighthouse tab, choose Mobile and Performance, and run it. This gives you a lab report on your own machine.
Run it five times and write down every result. Scores vary from run to run, even on the same page, because of network conditions and background activity. Use the median (the middle value), not the best or the worst.
Step 3: Measure the page without the chatbot
You don’t need to change your live site. Use Chrome DevTools to block the chatbot’s domain:
Open DevTools (F12) and go to the Network tab.
Reload the page and find the chatbot’s request (look for the vendor’s domain, such as
glanceia.comfor a Glanceia widget).Right-click it and choose Block request domain.
Run the same Lighthouse test again, five times.
(Menu labels vary a little between Chrome versions. If you can’t find the option, search for “Network request blocking” in DevTools.)
If you’d rather test a copy of your page without the script, that works too. Just keep everything else identical.
Step 4: Look at what the chatbot actually loads
While you’re in the Network tab, filter by the chatbot’s domain and note:
How many requests it makes
How much data it downloads (look at the “transferred” size)
When it loads: at the very start, or after the rest of the page
Then open the Performance tab, record a page load, and look for long tasks (marked in red) that come from the chatbot’s domain. Anything running longer than about 50 ms can block the browser from responding to a tap.
Lighthouse also has a third-party audit that lists how much main-thread time each outside domain used. Check how your chatbot compares with your analytics, fonts and other scripts. You might find the chatbot isn’t your biggest problem.
Step 5: Test the interaction itself
Lab scores often miss what happens after the page loads. In the Performance tab, start recording, then:
Click the chat bubble to open it
Type a short message
Close it
Look at how long the browser takes to respond to each action. If the chat window takes a second to open, visitors will feel that, whatever your Lighthouse score says.
Step 6: Record and compare
Use a simple log like this. The numbers below are examples only:
PageSettingLCPTBTCLSPage weightHomepageWith chatbot (median of 5)2.4 s180 ms0.021.8 MBHomepageWithout chatbot (median of 5)2.3 s120 ms0.021.6 MBDifference+0.1 s+60 ms0+0.2 MB
Do the same for your other two pages.
How to read the results
Here’s a practical way to interpret them. These rules of thumb are ours, not Google’s.
Is the difference real, or just noise? Look at the spread between your five runs. If the “with” and “without” medians differ by less than the natural spread between runs, treat it as no measurable impact.
Did a threshold change? The most useful question is whether the chatbot pushed a metric from “good” into “needs improvement.” A change from 2.3 s to 2.4 s keeps you comfortably under 2.5 s. A change from 2.4 s to 2.7 s doesn’t.
Which metric moved? Extra weight tends to show up in LCP on slow connections. Main-thread work shows up in TBT and INP. Layout shifts show up in CLS.
Does it matter on mobile? If it only hurts on slow mobile settings, that may still matter for your visitors.
What’s the trade-off? A small slowdown might be worth it if the chatbot captures leads and answers questions you’d otherwise miss. A big slowdown on your most important page probably isn’t. Measure both sides: speed and the number of chats and leads. Glanceia’s analytics show top questions and chat activity, which gives you the benefit side of the equation.
Check real visitors too
Lab tests tell you what the script costs. Real-user data tells you what visitors actually experienced.
Search Console: the Core Web Vitals report shows how real visitors experience your pages, if your site has enough traffic.
PageSpeed Insights field data: shown at the top of the report when available.
Your own measurement: Google’s web-vitals JavaScript library can send real-user metrics to your analytics.
Remember field data covers a rolling 28 days, so it won’t show a change immediately. If you install a chatbot, note the date, and compare the 28 days before and after. Small sites with little traffic may not have enough data to show anything, and that’s fine. In that case, trust the lab comparison.
If the chatbot does slow things down
Don’t panic and don’t necessarily remove it. Try these in order, from easiest to hardest.
1. Load it only where it helps. Does your blog need a chatbot on every post? Put it on pricing, product, booking and contact pages, where visitors have questions.
2. Load it later. Performance guides generally recommend deferring non-critical third-party scripts, so they don’t compete with your main content. The strongest version is loading the widget only after the page has loaded, after a short delay, or when the visitor shows intent (scrolls, moves the mouse, or taps a placeholder button). This is called a facade. Several guides specifically list chat widgets as good candidates.
3. Check how the script tag is added. Where it sits in your page matters. A script in the <head> that blocks loading is worse than one placed late or loaded with async or defer. Whether a given widget works properly with those attributes depends on the vendor, so ask them and then re-test.
4. Reserve space. If the widget injects anything that pushes content down, give it a fixed place so nothing shifts. Floating bubbles in a corner usually avoid this, but check your CLS.
5. Audit your other scripts. If your site loads a dozen outside scripts, the chatbot is rarely the whole story. Remove tools you no longer use.
6. Ask the vendor. Good questions: How large is the script, and is it cached on a CDN? Does it load asynchronously? Does it wait for the page to finish before starting? Can it load on interaction? Have you got performance numbers?
7. Re-test after every change. Run the same five-run test again, so you know the fix worked.
What about Glanceia?
We make Glanceia, so you should hear this from us plainly.
What we can say: according to the Glanceia site, installation is a single script tag added to your site, and it works with platforms such as WordPress, Shopify, Wix and Squarespace.
What we can’t promise in this article: an exact script size, load timing or Core Web Vitals impact for your site. We weren’t able to inspect the widget’s code or measure it independently for this piece, and results depend on your pages, your other scripts and your visitors’ devices. That’s exactly why we’re suggesting you test it. If you try Glanceia, run the test above on its free plan, and ask the team about loading behaviour through the contact page if the numbers surprise you.
The free plan, with no credit card required, makes this a low-risk experiment: install it on one page, test, compare, then decide.
A simple decision guide
What you findWhat to doNo measurable difference, thresholds unchangedKeep it, and re-test every few monthsSmall difference, still “good”Keep it, and consider loading it only on key pagesPushes a metric into “needs improvement”Load later or on interaction, restrict it to key pages, then re-testBig slowdown on an important pageRemove it from that page, ask the vendor for options and re-testInteraction feels sluggish when opening the chatInvestigate long tasks in the Performance tab, and talk to the vendor
Mistakes to avoid
Trusting one test run. Use five and take the median.
Testing on your fast laptop and Wi-Fi. Use mobile settings.
Testing with browser extensions on. Use an incognito window.
Comparing different pages or conditions. Change only one thing.
Ignoring the interaction. Test opening and using the chat.
Reading field data too soon. It reflects the last 28 days.
Obsessing over the score. A Lighthouse number matters less than real visitors’ experience and your business results.
Forgetting the benefit side. Count the questions answered and the leads captured.
Testing once and forgetting. Widgets, your site and browsers all change.
FAQ
Does a chatbot slow down a website?
It can, because it adds a third-party script. The effect varies widely by widget and by how it’s loaded. The only reliable answer is to measure it on your own pages.
How do I test chatbot impact on page speed?
Run Lighthouse or PageSpeed Insights on mobile settings with the chatbot enabled and again with its domain blocked in Chrome DevTools, five times each, and compare the medians.
What’s a good LCP, INP and CLS?
LCP of 2.5 seconds or less, INP of 200 milliseconds or less and CLS of 0.1 or less, measured at the 75th percentile of real visits.
Will a chatbot hurt my Google rankings?
Core Web Vitals are part of Google’s page experience signals, but relevance and content quality matter more. A slow widget could hurt, a light one probably won’t. Measure rather than guess.
Why doesn’t PageSpeed Insights show data for my site?
Real-user data needs enough Chrome visits. Small or new sites often don’t have it. In that case, rely on the lab comparison.
Can I load a chatbot only after someone clicks?
Often yes, using a placeholder button that loads the full widget on click, though how easily depends on the vendor. Ask your provider whether they support delayed or on-interaction loading.
Should I put the chatbot on every page?
Not necessarily. Pages where visitors have questions, such as pricing, product, booking and contact, benefit most.
Does Glanceia slow down my site?
We can’t answer that for your site without measuring it, so we’ve given you the method above. Test it on the free plan, and ask our team about loading behaviour if you want specifics.
How often should I re-test?
After any change to the chatbot, your theme or your scripts, and at least every few months.
Measure it, then decide
You don’t have to take anyone’s word for it, ours included. Thirty minutes, five runs and a simple table will tell you what a chatbot costs your page speed, and whether the questions it answers are worth that cost.
Glanceia is free to start with no credit card required. See the docs to get set up, or contact the team if you’d like to talk about performance on your site.